
Back to Services
SERVICE 08 — DASHBOARD & BI

Data that
Speaks
for Itself

We transform raw numbers into interactive dashboards and BI reports that executives actually use. PowerBI, Tableau, and Excel — built for your team, your data, your decisions.

Power BI
Tableau
Excel / VBA
SQL / DAX
40+ Dashboards Built
15+ Industries
3x Faster Decisions
ORIGIN AI — Sales Analytics Loading...
Revenue
$0
↑ 18.4% vs last month
Conversion
0%
↑ 3.2% vs last month
Clients
0
↓ 2 churned
Monthly Revenue Trend
Channel Mix
■ Direct 45%
■ Partner 32%
■ Online 23%
Top Products
Enterprise Suite
$1.2M
Analytics Pro
$890K
Starter Plan
$420K
Consulting
$280K
SCROLL
Power BI
Tableau
Excel / VBA
DAX / MDX
SQL & ETL
Custom Visuals
OUR TOOLS

Three Platforms,
One Expert Team

Power BI
Tableau
Excel / VBA
Microsoft Power BI

Enterprise-grade Analytics at Scale

Power BI is the industry standard for enterprise business intelligence. We build semantic models, custom DAX measures, Row-Level Security, and paginated reports that integrate with your entire Microsoft 365 ecosystem.

Custom DAX calculations and time-intelligence measures for financial and operational KPIs
Row-Level Security (RLS) and object-level security for multi-tenant, multi-department deployments
Power Query ETL pipelines connecting to 200+ data sources including SQL, APIs, SharePoint, and ERP systems
Embedded dashboards in web apps and custom portals via Power BI Embedded API
DAXPower QueryRLSPaginated ReportsEmbedded
Tableau

Visual Analytics That Tell Stories

Tableau is the gold standard for visual data storytelling. We design pixel-perfect Tableau workbooks with custom LOD calculations, table calculations, and Tableau Prep Builder pipelines — built for analysts who need to explore, not just report.

Level of Detail (LOD) expressions and complex table calculations for cohort and attribution analysis
Tableau Prep Builder ETL flows with automated refresh schedules on Tableau Server/Cloud
Custom map layers, spatial analysis, and geographic visualisations for territory and logistics reporting
Embedded Tableau views in Salesforce, web apps, and SharePoint with JWT authentication
LOD ExpressionsTableau PrepParametersMapsServer
Excel / VBA / Power Query

Automate the Spreadsheet You Can't Replace

Every organisation has mission-critical Excel workbooks that "just work." We automate, optimise, and extend them — VBA macros, Power Query transforms, dynamic arrays, and custom functions that eliminate manual work without replacing the tool your team knows.

VBA automation: one-click reporting, data validation workflows, and email triggers saving hours daily
Power Query & Power Pivot for self-refreshing models connected to live databases and APIs
Dynamic array formulas (XLOOKUP, FILTER, SEQUENCE, LAMBDA) replacing complex nested VLOOKUP chains
Executive-ready charts, conditional formatting, and protected interactive reporting templates
VBAPower QueryPower PivotDAXDynamic Arrays
01

Executive KPI Dashboards

C-suite dashboards that surface the 5–10 metrics that matter most — revenue, margin, pipeline, churn, and ops health — in a single view. Designed for speed: loaded in under 3 seconds, readable in under 10.

KPI CardsGoal TrackingDrill-throughMobile Ready
02

Sales & Revenue Analytics

Pipeline tracking, conversion funnel analysis, rep performance leaderboards, quota attainment, and win/loss breakdowns. Connected to your CRM in real-time so sales managers stop waiting for Monday morning reports.

PipelineFunnelCRM IntegrationForecasting
03

Financial Reporting & P&L

Automated P&L, balance sheet, and cash flow dashboards with variance analysis, budget vs actual comparisons, and rolling forecasts. Replace weekly Excel emails with a live report your CFO can trust.

P&LBudget vs ActualVariance AnalysisRolling Forecast
04

Operations & Supply Chain

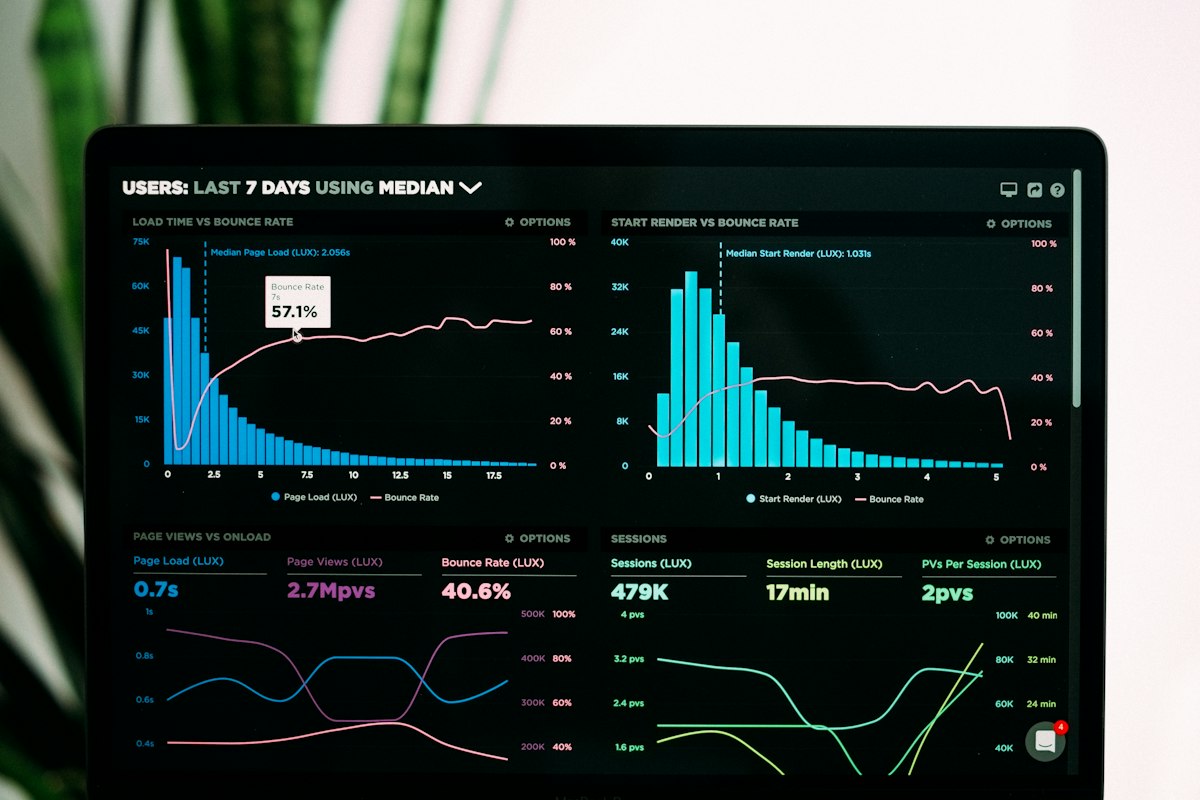
Real-time inventory, throughput, OEE, defect rates, supplier scorecards, and logistics tracking. Built for ops managers who need to act on data, not analyse it — every chart has a clear call-to-action threshold.
InventoryOEESupplier ScorecardLogistics
REAL-WORLD PROJECTS

From Data
to Insight

Every dashboard we deliver includes user training, a data dictionary, a refresh schedule, and 30-day post-launch support. We don't just build — we make sure your team can actually use it.
Executive dashboard
Retail / E-commerce
Power BI

Omnichannel Retail Command Centre

Real-time Power BI dashboard consolidating 12 data sources (Shopify, Amazon, SAP, Google Analytics, loyalty CRM) into a single executive view. Tracks 80+ KPIs across online, in-store, and wholesale channels with automated daily email snapshots to leadership.
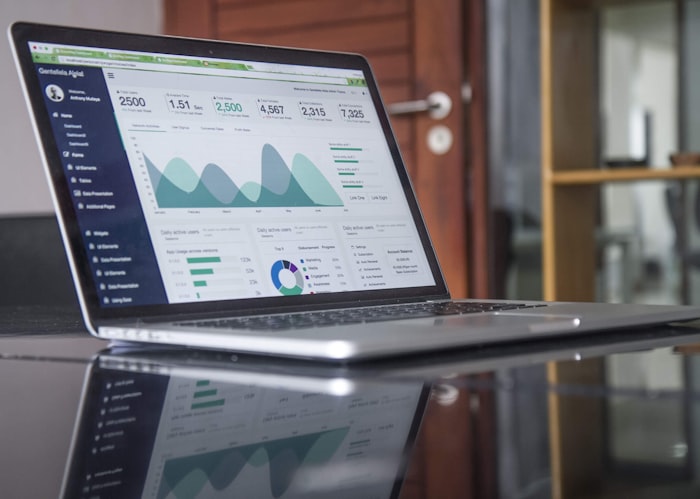
12Data Sources
80+KPIs Tracked
3sLoad Time
200+Daily Users
Power BIDAXPower QueryAzure SQLShopify API
Finance dashboard
Finance
Tableau

CFO Financial Intelligence Suite

Tableau workbook replacing 14 separate Excel reports. Live P&L, cashflow, EBITDA, and variance dashboards with 3-year rolling forecasts. Reduced monthly close reporting from 3 days to 4 hours.

14Reports Replaced
3d→4hClose Time
TableauTableau PrepPostgreSQLNetSuite API
Healthcare dashboard
Healthcare
Power BI

Hospital Operations Dashboard

Real-time bed occupancy, staff utilisation, wait times, and readmission tracking for a 500-bed hospital. Row-Level Security ensures doctors see only their ward data.

500Bed Hospital
RLSWard-level Security
Power BIDAXFHIR APIAzure
Manufacturing
Manufacturing
Excel / VBA + Power BI

Production OEE & Quality Tracker

Automated Excel-based shift reports via VBA feeding a live Power BI OEE dashboard. Downtime classification, defect Pareto charts, and SPC control charts for quality team.

OEELive Tracking
78%Manual Work ↓
Excel VBAPower BISQL Server
HR dashboard
HR & People Analytics
Tableau

People Analytics & Workforce Dashboard

Headcount, attrition, diversity, time-to-hire, and engagement score tracking across 2,000 employees in 12 countries. LOD expressions for cohort analysis and benchmarking.

2kEmployees
12Countries
TableauWorkday APILODSnowflake
TECHNOLOGY STACK

Tools We
Master

PBI
Power BI
Microsoft BI
TBL
Tableau
Visual Analytics
XL
Excel / VBA
Automation
DAX
DAX / MDX
Calculations
SQL
SQL / T-SQL
Data Queries
PQ
Power Query
ETL / Transform
AZ
Azure Synapse
Cloud Data Warehouse
SF
Snowflake
Data Platform
DB
Databricks
Big Data
GS
Google Looker
BI Platform
DT
dbt
Data Transformation
AF
Apache Airflow
Pipeline Scheduling
HOW WE WORK

Our Dashboard
Process

01
Discovery
Map your decisions, your data sources, and who needs what. No wireframe before we understand the questions.
02
Data Audit
Assess data quality, identify gaps, and design the ETL pipeline before touching the BI tool.
03
Design & Build
Wireframe first, build second. Every visual serves a decision — no decoration for decoration's sake.
04
UAT & Feedback
Two rounds of stakeholder review with tracked feedback — launch only when every number is verified.
05
Deploy & Train
Live deployment, user training, data dictionary handover, and 30-day post-launch support included.
READY TO BUILD

Your Data Is
Ready to Talk

Tell us your data sources, your audience, and the decisions you need to make faster. We'll design a dashboard that earns its place on your screen every day.

Start a Project Other Services